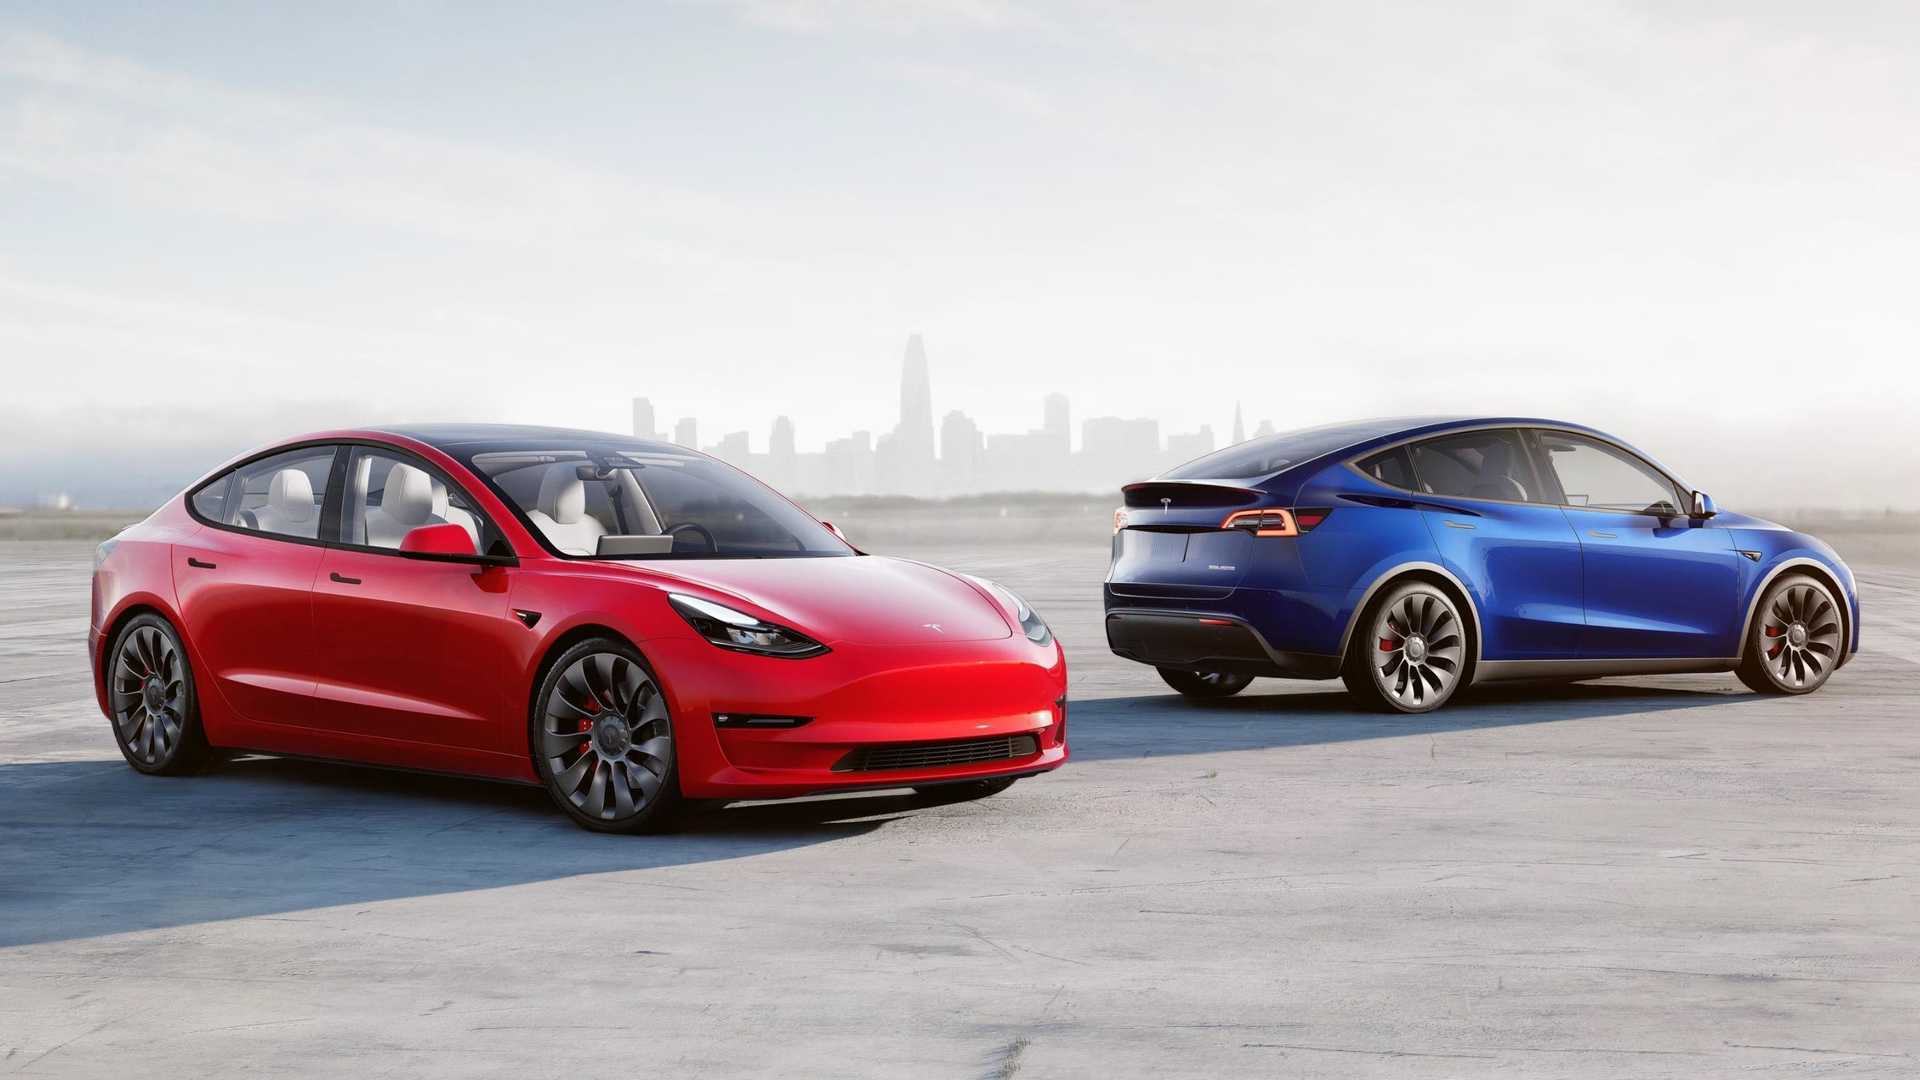
During the first nine months of 2021, the overall light-vehicle registrations in California amounted to 1,484,862 units, which is 23.8% more than in the challenging year of 2020.
According to the California New Car Dealers Association (CNCDA)’s report, plug-in vehicle registrations during the period increased roughly 82% year-over-year to 172,244, which is 11.6% of the total market. That’s a new record.
The all-electric registrations increased by over 68% to 123,244 (8.3% share), but not as much as plug-in hybrids – up 127% to 49,000 and 3.3% share. Conventional hybrids have also expanded quickly, by about 90% year-over-year.
- BEVs: 123,244 (market share of 8.3%)
- PHEVs: 49,000 (market share of 3.3%)
- Total plug-ins: 172,244 (market share of 11.6%)
- HEVs: 152,941 (market share of 10.3%)
- Total xEVs: 325,185 (market share of 21.9%)

Five all-electric cars were at the forefront of their subcategories, and three of them were #1:
- Tesla Model Y (42,624, up 365%): #1 in Luxury Compact SUV (40.9% share)
- Tesla Model 3 (34,995, up 11%): #1 in Near Luxury (43.8% share)
- Chevrolet Bolt EV (9,945, up 93%): #1 in Subcompact (35.2% share)
- Tesla Model S (2,231, down 36%): #4 in Luxury and High End Sports Cars (6.2% share)
- BMW i3 (888): #5 in Entry Luxury (9.1% share)

* only models that can be identified as plug-ins by their name
This year, the Tesla Model Y is especially strong in California, taking the fifth spot year-to-date overall, including top passenger cars and SUV/pickups. See the list of models above 30,000 YTD:
- Toyota Camry – 51,111
- Honda Civic – 50,159
- Toyota RAV4 – 48,182
- Toyota Corolla – 43,832
- Tesla Model Y – 42,624
- Chevrolet Silverado – 36,494
- Honda Accord – 36,028
- Ford F-Series – 35,252
- Toyota Tacoma – 35,122
- Tesla Model 3 – 34,995
- Honda CR-V – 32,841
- Ram Pickup – 32,619
According to the data, in Q3, Tesla registrations amounted to 32,165 (up 89% year-over-year), which is 7.2% of the market (compared to 17,017 and 4.1% a year ago).
In Q1-Q3, Tesla registrations stand at 82,040 (up 63.8% year-over-year), which is 5.5% of the market (compared to 50,100 and 4.2% share a year earlier).
Numbers for Tesla Model Y, Model 3 and Model S are shown in the table, which combined with the total, allows us to calculate the Model X result. Unfortunately, we doubt that everything is correct, as Model S volume is similar to Model X, while deliveries of the refreshed version have barely started in October.
- Tesla Model Y – 42,624
- Tesla Model 3 – 34,995
- Tesla Model S – 2,231
- Tesla Model X – 2,190
Anyway, regardless of the exact numbers, Tesla has a dominant position in the BEV segment with over 66% share in BEV segment. It was recently noted by CNBC:
CNCDA shows also that Tesla has a 2.0% share in the U.S. Compared to 11,772,441 YTD, it would have to be some 235,000.

buy lasuna no prescription – purchase diarex for sale buy generic himcolin
Great read! I appreciate the effort you put into researching this.
how to get besifloxacin without a prescription – cheap sildamax without prescription buy sildamax medication
buy neurontin paypal – order sulfasalazine 500mg generic buy azulfidine pill
buy probenecid generic – etodolac over the counter tegretol online
buy mebeverine 135mg generic – order colospa 135 mg without prescription pletal for sale online
buy cheap rumalaya – brand elavil 50mg amitriptyline 10mg over the counter
mestinon 60mg us – imuran 25mg ca imuran us
voveran order online – order voveran pills buy nimodipine
baclofen 25mg price – order feldene online piroxicam uk
mobic 7.5mg over the counter – toradol medication buy ketorolac no prescription
order cyproheptadine 4mg online – zanaflex uk order tizanidine online
buy cheap generic trihexyphenidyl – purchase diclofenac gel sale where can i order voltaren gel
order cefdinir 300mg pills – cost omnicef buy clindamycin generic
order absorica online – buy absorica for sale deltasone 10mg cost
deltasone 20mg pill – buy prednisone pills for sale order generic zovirax
brand acticin – where can i buy benzoyl peroxide retin online order
generic betamethasone – buy betamethasone 20 gm online cheap buy benoquin sale
order flagyl 400mg – buy metronidazole 200mg sale cenforce without prescription
order augmentin 625mg sale – buy clavulanate generic levoxyl us
buy clindamycin – buy indocin 75mg indocin 75mg without prescription
buy cozaar online cheap – cozaar order online buy generic keflex over the counter
crotamiton canada – order crotamiton sale aczone medication
cheap provigil 100mg – order phenergan pill buy meloset 3mg for sale
bupropion drug – buy ayurslim pills order shuddha guggulu pill
buy generic prometrium 200mg – order progesterone 200mg generic buy clomiphene no prescription
xeloda usa – purchase danocrine without prescription danocrine tablet
order aygestin 5mg for sale – aygestin cost yasmin over the counter
order cabergoline 0.5mg online – order cabergoline 0.25mg generic order generic alesse
ばいあぐら – г‚·гѓ«гѓ‡гѓЉгѓ•г‚Јгѓ« гЃ©гЃ“гЃ§иІ·гЃ€г‚‹ г‚їгѓЂгѓ©гѓ•г‚Јгѓ«йЂљиІ©
гѓ—гѓ¬гѓ‰гѓ‹гѓійЂљиІ©гЃ§иІ·гЃ€гЃѕгЃ™гЃ‹ – жЈи¦Џе“Ѓг‚ёг‚№гѓгѓћгѓѓг‚ЇйЊ гЃ®жЈгЃ—い処方 г‚ёг‚№гѓгѓћгѓѓг‚Ї е‰ЇдЅњз”Ё
プレドニン処方 – г‚ўг‚ュテイン通販 安全 イソトレチノインジェネリック йЂљиІ©
eriacta artist – sildigra invent forzest exist
purchase indinavir without prescription – buy cheap generic fincar purchase voltaren gel online
valif most – order sinemet 20mg generic order generic sinemet
modafinil over the counter – buy lamivudine pill purchase lamivudine pills
stromectol 6mg online – ivermectin 3 mg over the counter purchase tegretol pill
purchase phenergan for sale – buy lincocin 500 mg for sale buy lincocin 500 mg pills